Research Datasets
CBI collects data in partnership with other research organizations to advance the understanding of the Congo Basin. Our datasets are freely available to other researchers with proper citation.
Status: Ongoing
Bouamir Weather Station Data
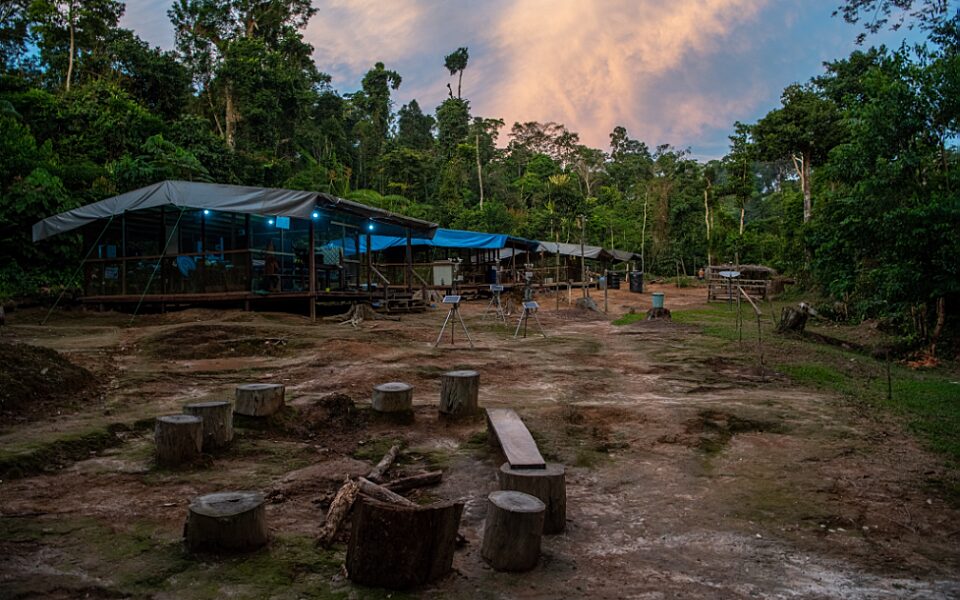
The Congo Basin Institute and the Ministry of Forestry and Wildlife (MINFOF) manage a weather station at Bouamir Field Station(coordinates: 3°11’26″N 12°48’43E). Weather data has been collected continuously at Bouamir since 2017 via two different methods (davis/weatherlink and manual). Clean weather data is available from 2017-present on Zenodo. Click below to access the full dataset.
Citation: Deblauwe, V., Smith, T., Ordway, E., Stouter, H., LeBreton, M., Tatemnao, J. J. R., Wabo Puemo, F. A., Oum Ndjock, G., & Assola, S. (2024). Bouamir Weather Station Data [Data set]. Zenodo. https://doi.org/10.5281/zenodo...
1) Temperature and rainfall manually recorded daily since 24/10/2017.
- Rainfall (mm) measured with Tru-Chek® Direct-Reading Rain Gauge. The gauge is graduated from 0.1 mm to 150 mm. The uppermost part/opening of the rain gauge is located 2 meters above ground level.
- Minimum and maximum temperature of the last 24h are recorded with Forestry Suppliers Digital Max/Min Thermometer. Measurement Range: -40°C to 50°C. Accuracy: ±1°C. The temperature sensor is located 1.5 meters above ground level.
Automatic (Davis) Data collection
2) A DAVIS Vantage Pro2 Plus automatic station records the following parameters every 30 minutes from 19/10/2019 5am and every 15 minutes from 11/12/2019 1pm. The wind speed and direction sensors are located about 2.5 m above ground level. All other sensors are located about 2 meters above ground level.
- Rainfall (±3% of total or ± one tip of the bucket (0.01″/0.2mm), whichever is greater)
- Temperature (±0.5°F or ±0.3°C; Radiation Induced Error: +4°F or 2°C at solar noon (insolation = 1040 W/m2, avg. wind speed <= 1 ms)).
- Humidity (±2%)
- Wind speed (±2 mph (2 kts, 3.2 km/h, 0.9 m/s) or ±5%, whichever is greater)
- Wind direction (±3°)
- Atmospheric pressure (±0.03″ Hg or ±0.8 mm Hg or ±1.0 hPa/mb)
- Ultra Violet (UV) Radiation Dose (±5% of daily total, drift up to ±2% per year)
- Ultra Violet (UV) Radiation Index (±5% of full scale)
- Visible light Solar Radiation (±5% of full scale, drift up to ±2% per year)
Full specifications of the sensors
We also provide the following derived variables:
- Heat Index (±2°F or ±1°C)
- Dewpoint (±2°F or ±1°C)
- THSW Index (Temperature-Humidity-Sun-Wind) (±4°F or±2°C)
- THW Index (Temperature-Humidity-Wind)
- Barometric Pressure ( ±0.03″ Hg or ±0.8 mm Hg or ±1.0 hPa/mb)
- Rain rate (±5% for rain rates)
- ET (Evapotranspiration) (Greater of 0.01″ (0.25 mm) or ±5%)
- Wind Chill (2°F or ±1°C)